Company Analysis 2: Quantitative Analysis of Financial Statements

Analysis of Finacial Statements

The financial statements of a company are like the pulse of the human body. As a seasoned ayurvedic practitioner can examine health conditions from just the pulse while a normal person can hardly feel any difference, a professional investor can examine a company's financial health from financial statements. This makes financial statement analysis one of the most important parts of equity analysis. A complete financial statement analysis consists of:
- Profit and Loss Statement (P&L Statement) Analysis
- Balance Sheet Analysis
- Cash flow statement Analysis
We have already discussed what these statements are in the article 'Company Analysis 2: Quantitative Analysis, Introduction to Financial Statements'. If you have not read that article I will suggest you read it for better understanding. Now we will get straight into the analysis part and be assured I will keep it as simple as possible.
Profit and Loss Statements
 |
| Sample P&L statement from Annual Report |
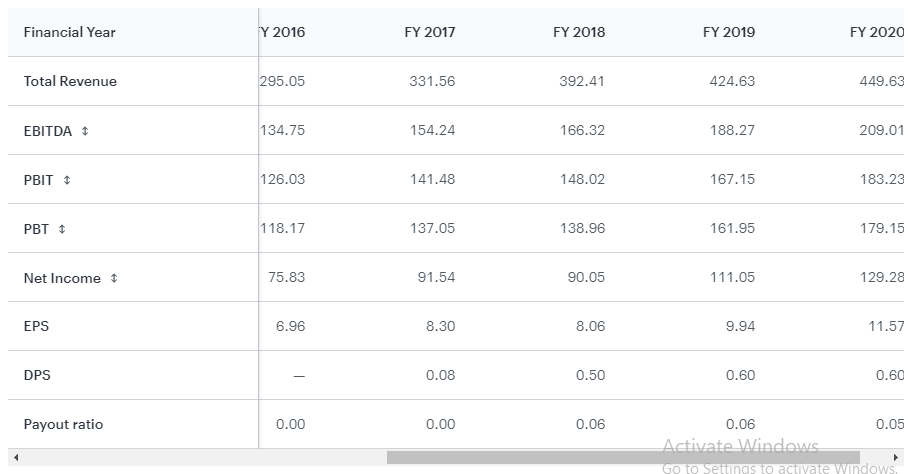 |
| Sample P&L statement from a content and information platform |
The screenshots shared above are Consolidated P&L statements of the same company as published on different platforms. Whichever format you prefer depends on you, ultimately we have to focus on only three rows only:
- Total Revenue: Total revenue of a company is nothing but the total value of products and services comapany sold in the year under consideration. Total revenue can also be termed as Net Sales.
- EBITDA: EBITDA is Earnings before Interest, Tax, Depreciation, and Amortization. In simple words, EBITDA is operating profit of the company.
- Net Income: Net income is the profit earned by the company after paying all the expenses.
If one understands this it is not rocket science to differentiate a good company from bad ones. Anyone can easily prepare rules for differentiation as follows:
- Good Company: The overall trend for Total Revenue, EBITDA, and Net Income is rising and the rate of rising is better compared to peers.
- Average Company: The overall trend for Total Revenue, EBITDA, and Net Income does not show a clear rise or fall. In a few years, it is rising while in others it is falling. Over five years the rate is in line with peers.
- Bad Comapany: The overall trend for Total Revenue, EBITDA, and Net Income is falling.
- If Total Revenue is rising but EBITDA and Net Income are either stalled or falling. It shows falling margins which is not a good sign.
- If Total Revenue and EBITDA is rising but Net Income is stalled or falling then one needs to go deeper to check which expenses are rising. If interest payments are rising then the balance sheet needs attention to check if the company is falling into debt trap or debt is manageable.
- If Total Revenue is stalled but EBITDA and Net Income are rising it shows an increase in margins which is a good sign.
Balance Sheet
 |
| A sample Balance sheet from Annual Report |
 |
The screenshots shared above are consolidated balance sheets of the same company from different sources. A balance sheet is an account of assets (amount receivable), liabilities(amount to pay), and Equity(shareholder's capital). While analyzing the balance sheet our main focus should be to check whether the company is capable of paying all its liabilities or not. To do this the easiest way is to calculate the debt/equity ratio and the current ratio. - Debt/Equity Ratio: Debt/Equity ratio is the ratio of total liabilities of the company to shareholder's equity. Lower the ratio better it is. I am mentioning a few reference ratios below, while they can be used as a reference in most of the industries, checking the debt/equity ratio of peers can guide you better for your investment decision.
- A company with debt/equity less than 1 is most favorable.
- If debt/equity is between 1-2 one should be cautious while investing.
- Debt/equity ration more than 2 will never be recommended for investing, at least from me as the probability of comapany not being able to pay off debt are high.
- Current Ratio: While Debt/Equity ratio is a good measure of long term sustainability of a company, it may not be that effective check short term sustainability. To check short term sustainability the current ratio is used. The current ratio is the ratio of current assets to current liabilities. A higher current ratio is considered to be favorable but in some cases, too high current ratio gives a negative indication. A current ratio around 2:1 is considered ideal.
Cash Flow Statement

A cash flow statement is one that traces money flow into and out of the company. It gives a clear idea of how much money is being actually made by carrying out business activities and where the money is being spent.
Analyzing the cash flow statement has no hard and fast rules as in the case of previous two statements.
- +ve Operating Activity shows the money made by carrying out business last year. Clearly a good sign.
- -ve Operating activity indicates money lost by carrying out a business activity. Clearly a bad sign.
- -ve investing activity shows the company is investing money either for expansion, getting into new ventures, or paying investors dividends. The majority of the time it is a good sign but we should check if the company is not getting into a wrong venture.
- +ve investing activity indicates company is selling its assets to for cash. The majority of the time it is a bad sign but at times the company may be selling some outdated technology plants or non-operative plants which can be good sign as well.
- +ve financing activity means the company is borrowing money. Whether this borrowing is good or bad depends upon why is the company borrowing. If it is borrowing for expansion it can be a good sign but if it is borrowing because it is short of funds to run operations it is a bad sign.
- -ve financing activity means company is paying off loans, generally considered to be a good sign.
You have just finished reading the hardest part of the equity analysis process. I recommend you to read this article twice. If you still do not understand any part of it please make sure to comment below I will try my best to answer your queries.
And don't forget to Read To Learn Investing.


Comments
Post a Comment
If you have any doubt please comment